Simulation structure
[Multitarget-multisensor Tracking: Principles and Techniques : Yakkov Bar-Shalom Xiao-Rong Li]
Simulation and visualization
A simple sailboat model is moving according to a deterministic Constant Turn rate and Velocity (CTRV) model. Given the known starting state of the target $x_0$ ,
- Initialize EKF at $x_0$
- Initialize PF at $x_0$
- Perform target deterministic motion update
- Obtain noisy observations (if any) $z$ from different rate sensors.
- Update the estimate of each filter with the given observations if any, using PDA.
- Plot the weighted particles above the PF state estimate where the height of a particle depends on its likelihood.
- Plot x-y uncertainty ellipsoids of the EKF around the state estimation.
Multiple moving objects
So far, the data association problem was not considered, that is the filtering algorithms were certain about the origin on the measurements. Data association is a major component of a tracking algorithm both because of the existence of multiple measurement sources, but also because of the existence of outliers in the measurements.
The approach implemented so far is a Probablistlic Data Association(PDA) algorithm. The goal again is in the update state, to associate measurements with different tracked targets based on a certain criterion described in the algorithm.
Mathematical explanation will be documented at a later stage, for now a visualization of the simulation is shown below.
- Three different targets visualised
- Both EKF & PF Filtering for each target
- Triple crossing of targets, but the filters are able to associate correctly the measurements and correctly estimate the trajectories.
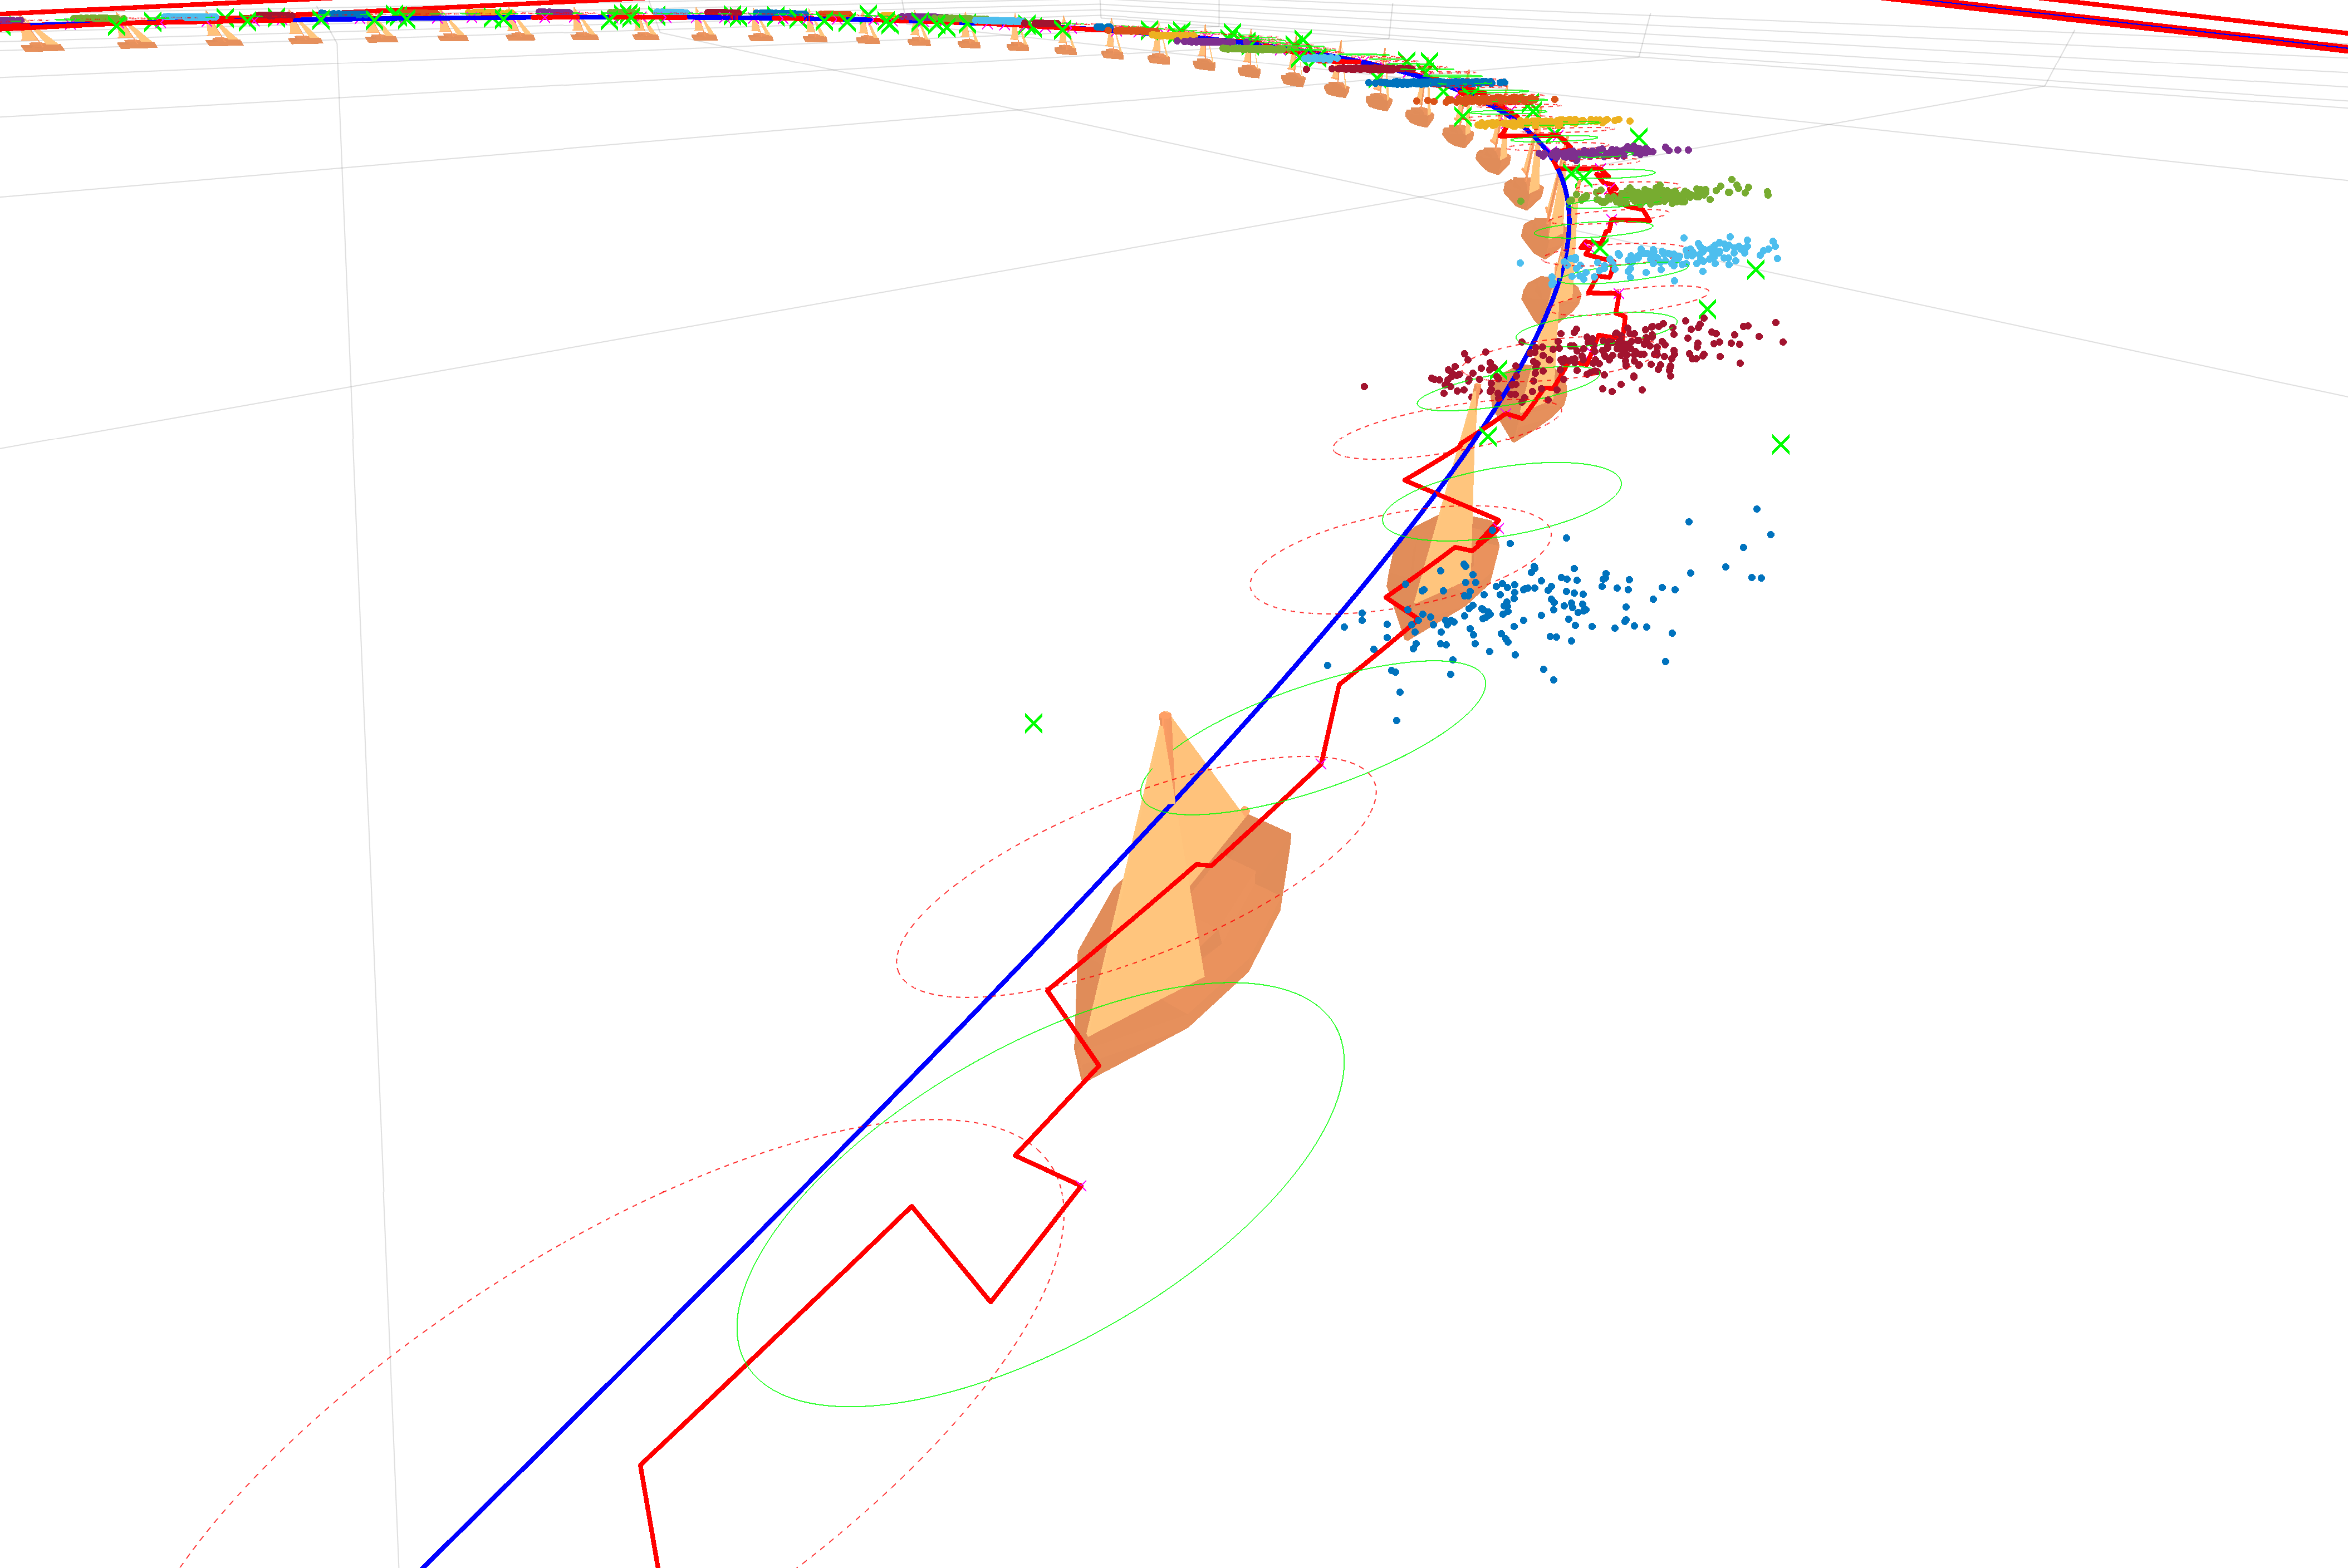
3d view
- Continuous lines correspond to PF x-y state estimates for each target.
- Magenta ellipsoids correspond to EKF state uncertainty
- Point-clouds above the sailboats correspond to each target’s particle distibutions where the height and size of a particle depends on its likelihood.(overall number of particles N=300 for each target).
- Filters are associating the measurements to the correct targets at all times.
2d top-view
- Continuous lines correspond to moving objects deterministic trajectories.
- Blue scatter ‘x’ points correspond to the history of noisy radar measurements sensed from all the available targets.
- Dashed lines correspond to the Particle Filtered x-y state estimate evolution over time. PDA is correctly associating the measurements to the measurement origin.

Dimitrios Dagdilelis
ML/AI Engineer
Hey there, I enjoy making machines observe the world. If you have something interesting to share, there is no better time that now, connect with me and lets discuss.